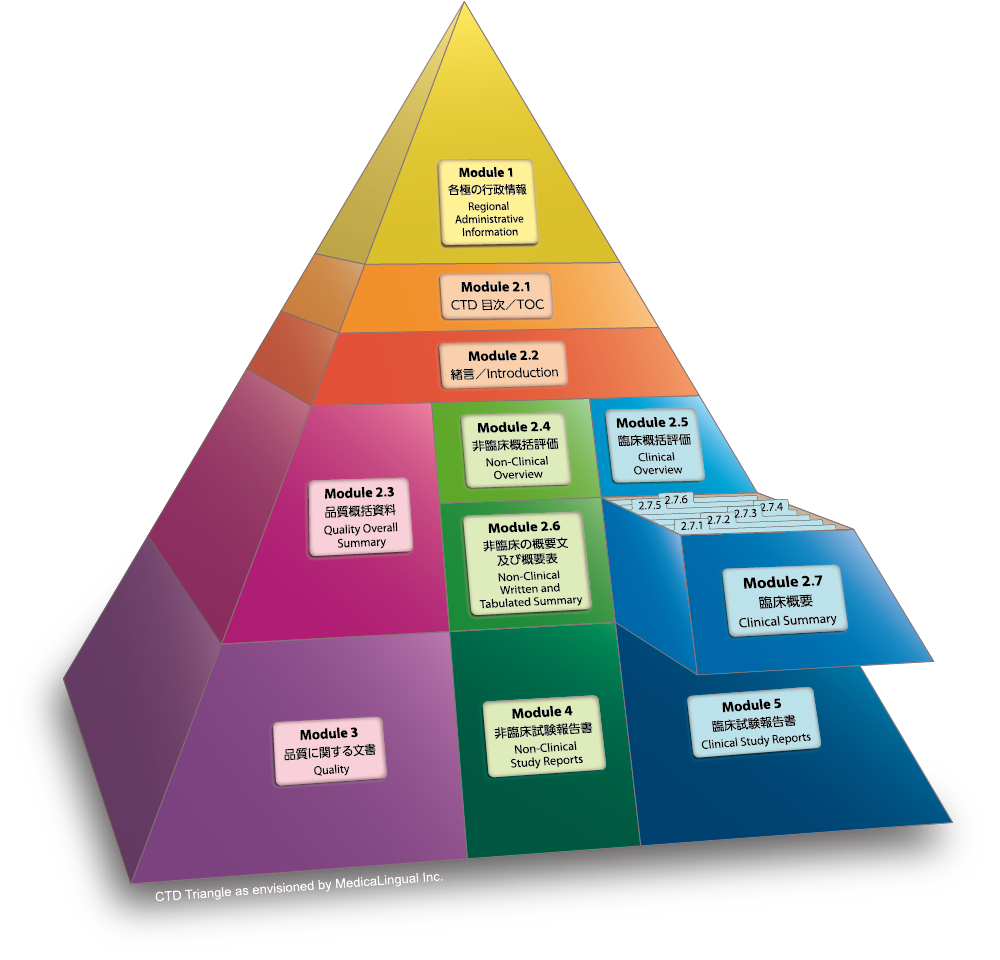
薬生薬審発0202第1号(平成29年2月2日)
ICH HARMONISED GUIDELINE- M4E(R2) – Dated 15 June 2016
Module 2.7 臨床概要
2.7.4 臨床的安全性の概要
2.7.4.3 臨床検査値の評価
本項では、被験薬の使用に伴う臨床検査値の変動パターンを要約すること。顕著な異常や何らかの処置を要したものは第2.7.4.2.1.3項又は第2.7.4.2.1.4項に報告すること。もし、それらのデータを本項に記載する場合は、内容が重複していることを示すこと。臨床検査値の評価は、得られた結果そのものから行いうるが、通常、以下に列記する解析も実施し記載すること。各解析は、試験規模を考慮しつつ、被験薬群と対照薬群とで比較すること。各検査項目に対し正常範囲を示すこと(ICH E3)。可能であれば、臨床検査値は国際標準単位で示すこと。
Module 2.7 CLINICAL SUMMARY
2.7.4 Summary of Clinical Safety
2.7.4.3 Clinical Laboratory Evaluations
This section should describe changes in patterns of laboratory tests with drug use. Marked laboratory abnormalities and those that led to a substantial intervention should be reported in section 2.7.4.2.1.3 or 2.7.4.2.1.4. If these data are also presented in this section, this duplicate reporting should be made clear for the reviewer. The appropriate evaluations of laboratory values will in part be determined by the results seen, but, in general, the analyses described below should be provided. For each analysis, comparison of the treatment and control groups should be carried out, as appropriate and as compatible with study sizes. In addition, normal laboratory ranges should be given for each analysis (ICH E3). Where possible, laboratory values should be provided in standard international units.
全ての試験を通して、重要な臨床検査値の変動に関し簡単に概括すること。臨床検査データとしては、血液学的検査、血液生化学的検査、尿検査、その他必要に応じて実施された検査データを含む。治験期間中の各測定点(来院時等)で得られた各パラメータは以下の3段階にて表記すること。
- 中心傾向、例、群の平均値及び中央値
- 値の範囲及び異常値を示した被験者数、又は特定の範囲(例:正常値範囲の上限の2倍、上限の5倍等。その選択について説明すること)の異常値を示した被験者数。もしも、正常範囲が異なる施設からのデータを併合する時、併合に用いた方法を記載すること。各投与群における被験者の変動の解析には適宜いろいろな方法を用いることができる(例:シフトテーブル、ICH E3を参照)。
- 中止例を含む、臨床的に重要な個々の臨床検査値異常。
A brief overview of the major changes in laboratory values across the clinical studies should be provided. Laboratory data should include haematology, clinical chemistry, urinalysis and other data as appropriate. Each parameter at each time over the course of the study (e.g., at each visit) should be described at the following three levels:
- the central tendency, i.e., the group mean and median values,
- the range of values, and the number of subjects with abnormal values or with abnormal values of a certain size (e.g. twice the upper limit of normal, 5 times the upper limit; choices should be explained). When data are pooled from centres with differences in normal laboratory ranges, the methodology used in pooling should be described. The analysis of individual subject changes by treatment group can be shown with a variety of approaches (e.g., shift tables, see ICH E3 for examples).
- individual clinically important abnormalities, including those leading to discontinuations.
これらの臨床検査値の変動についてその重要性及び医薬品との関連性を評価すること(例:投与量との関連性、薬物濃度との関連性、治療継続で消失、投与中止で消失、再投与で再発、併用療法の内容)。第2.7.4.2.1.1項で示した他の因子との関連についても検討すること。
The significance of the laboratory changes and the likely relation to the treatment should be assessed (e.g., by analysis of such features as relationship to dose, relation to drug concentration, disappearance on continued therapy, positive dechallenge, positive rechallenge, and the nature of concomitant therapy). Potential relationships to other factors listed in Section 2.7.4.2.1.1 should also be considered.


