治験の統括報告書の構成と内容に関するガイドライン
平成8年5月1日 薬審第335号
各都道府県衛生主管部(局)長あて 厚生省薬務局審査課長通知
STRUCTURE AND CONTENT OF CLINICAL STUDY REPORTS
Recommended for Adoption at Step 4 of the ICH Process on 30 November 1995 by the ICH Steering Committee
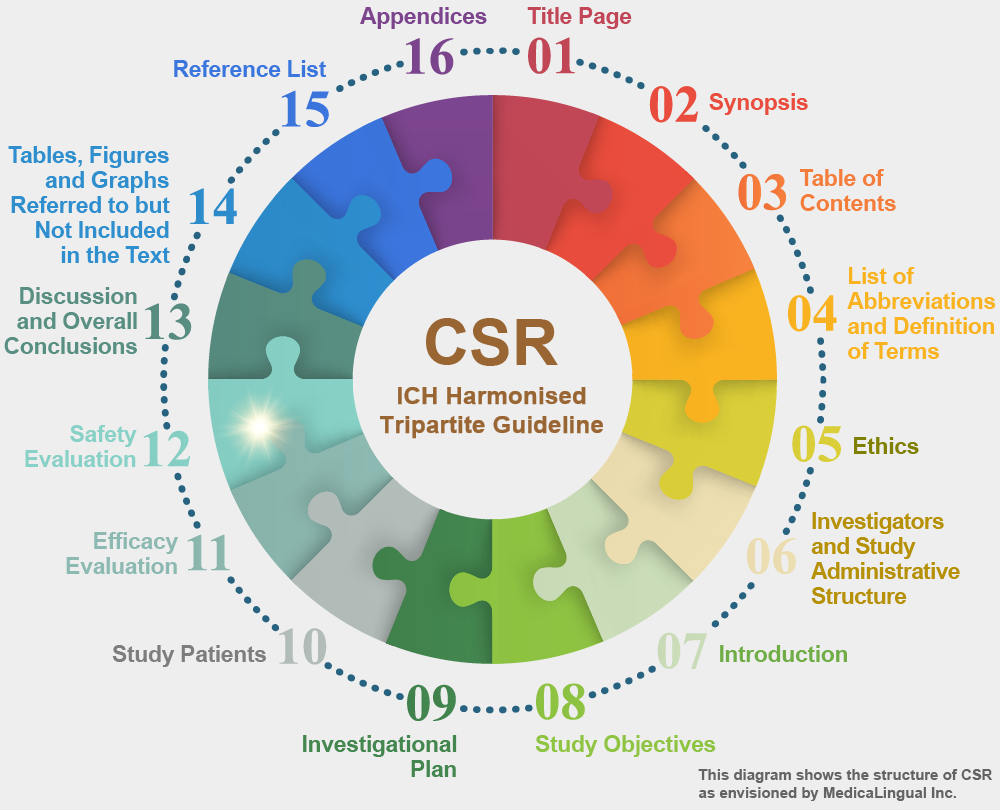
12. 安全性の評価
12.2 有害事象
12.2.2 有害事象の表示
試験治療の開始後に発現した全ての有害事象(審査当局との間で,あらかじめ特定の事象は疾患に関連するものとして取り扱うとの合意に達していないならば,基礎疾患に関連していそうな,又は合併症を表していそうな事象を含む)を要約表(14.3.1項)に表示すること。表には,重篤な有害事象又は他の重要な有害事象と考えられたバイタルサインの変化及び臨床検査値の変化を含めること。
12. SAFETY EVALUATION
12.2 ADVERSE EVENTS (AEs)
12.2.2 DISPLAY OF ADVERSE EVENTS
All adverse events occurring after initiation of study treatments (including events likely to be related to the underlying disease or likely to represent concomitant illness, unless there is a prior agreement with the regulatory authority to consider specified events as disease related) should be displayed in summary tables (section 14.3.1). The tables should include changes in vital signs and any laboratory changes that were considered serious adverse events or other significant adverse events.
ほとんどの場合,このような表に「治療により発現した兆候及び症状」(TESS;治療前には見られなかった事象及び治療前からあったが治療中に悪化した事象)を記述することが役立つ。
In most cases, it will also be useful to identify in such tables “treatment emergent signs and symptoms” (TESS; those not seen at baseline and those that worsened even if present at baseline).
その表には,個々の有害事象の名称,各治療群においてその事象が発現した患者数及び発現率を示すこと。例えば,癌化学療法のように治療が周期的に行われる場合には,各周期ごとに結果を分けて表示することが有用なこともある。有害事象は器官別にグループ化すること。もし重症度尺度(例えば,軽度,中等度,高度)が定義されているなら,各事象をその尺度で分類してもよい。またこの表では,有害事象を薬剤の使用と少なくとも関連があるかもしれないと考えられる事象と,関連なしと考えられる事象に分類してもよいし,他の適当な因果関係分類(例えば,関連なし,関連があるかもしれない,おそらく関連あり,明らかに関連あり)を用いてもよい。
The tables should list each adverse event, the number of patients in each treatment group in whom the event occurred, and the rate of occurrence. When treatments are cyclical, e.g., cancer chemotherapy, it may also be helpful to list results separately for each cycle. Adverse events should be grouped by body system. Each event may then be divided into defined severity categories (e.g., mild, moderate, severe) if these were used. The tables may also divide the adverse events into those considered at least possibly related to drug use and those considered not related, or use some other causality scheme (e.g., unrelated or possibly, probably, or definitely related).
このような因果関係の評価を用いた場合でも,関連性の有無の評価に関係なく,併発症と考えられる事象も含む全ての有害事象を表に含めること。当該治験又は安全性に関するデータベース全体をさらに分析することは,有害事象が薬剤に起因するか否かを明らかにすることの助けになることもある。これらの表のデータの分析及び評価を可能とするために,個々のどの患者にどの有害事象が発現したかがわかるように示すことが重要である。このような表形式の提示の例を以下に示す。
<表略>
Even when such a causality assessment is used, the tables should include all adverse events, whether or not considered drug related, including events thought to represent intercurrent illnesses. Subsequent analyses of the study or of the overall safety data base may help to distinguish between adverse events that are, or are not, considered drug related. So that it is possible to analyse and evaluate the data in these tables, it is important to identify each patient having each adverse event. An example of such a tabular presentation is shown below.
(Table Omitted)
14.3.1項に示されるこれらの完全な表に加えて,比較的頻度の高い(例えば,治療群の少なくとも1%に見られる)有害事象について,患者の識別番号を用いずに,被験薬群と対照群を比較した要約表を報告書の本文中に追加すること。
In addition to these complete tables provided in 14.3.1, an additional summary table comparing treatment and control groups, without the patient identifying numbers limited to relatively common adverse events (e.g., those in at least 1% of the treated group), should be provided in the body of the report.
有害事象の提示にあたっては,治験責任医師が用いたとおりの用語で提示することも,関連する事象(つまり,おそらく同一の現象を表す事象)をグループ化しようとすることも,ともに重要である。グループ化することによって真の発現率があいまいでなくなる。このための一つの方法は,標準的な副作用・有害事象用語辞書を用いることである。
In presenting adverse events, it is important both to display the original terms used by the investigator and to attempt to group related events (i.e., events that probably represent the same phenomena) so that the true occurrence rate is not obscured. One way to do this is with a standard adverse reaction/events dictionary.


